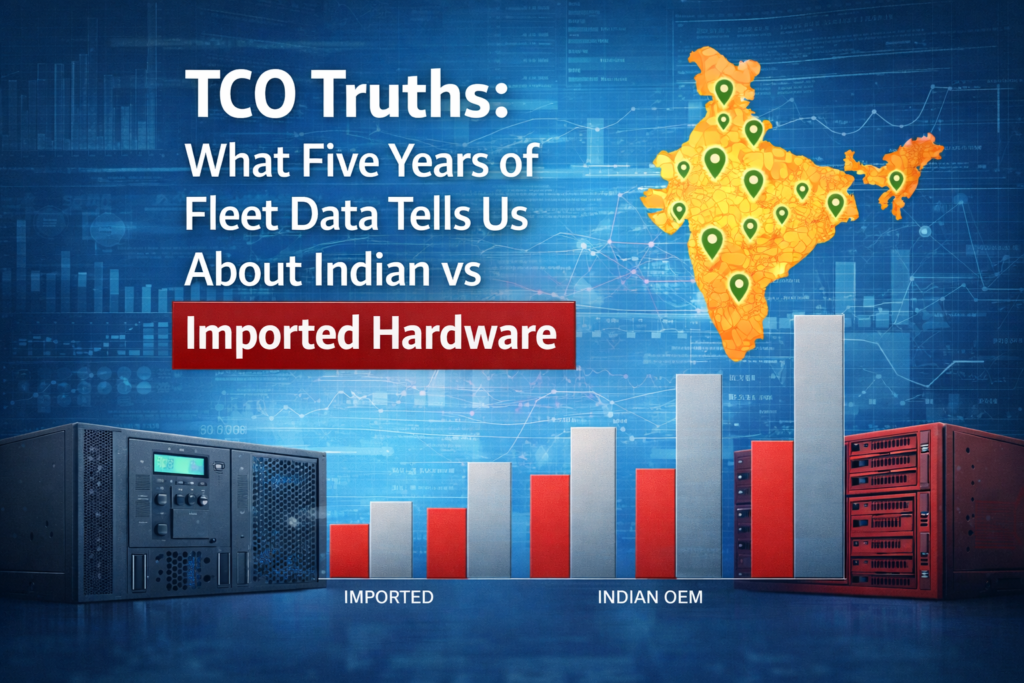
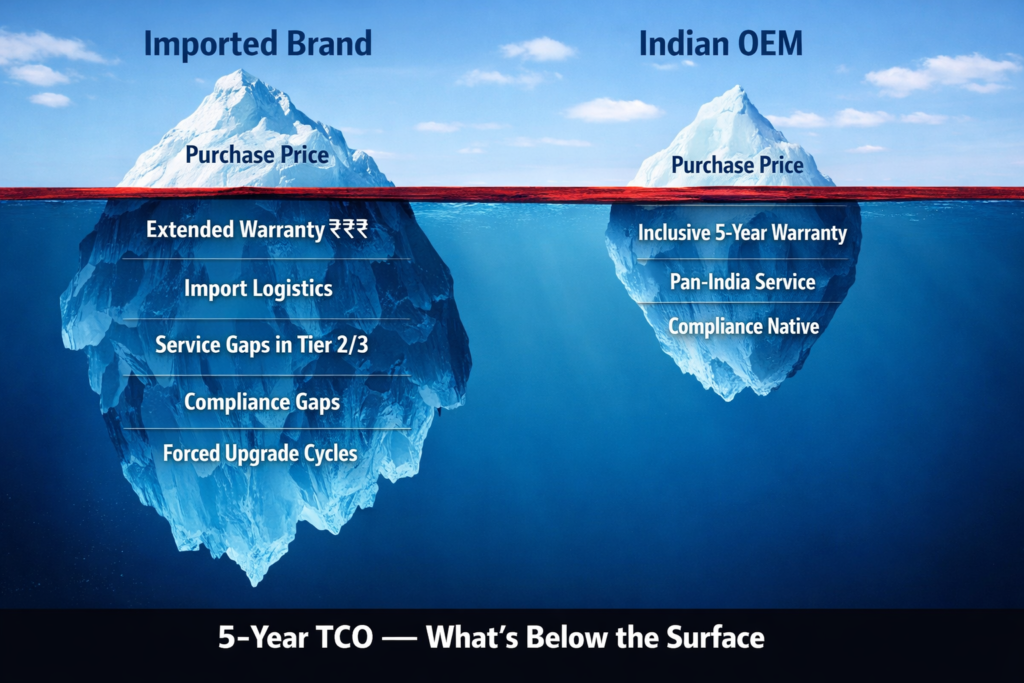
TCO conversations usually live in RFP footnotes. Pull the thread, and five variables explain almost all of the five-year cost difference between an Indian and an imported fleet: capex, support response time, warranty claim rate, field-serviceability, and residual value. Here’s what each looks like from inside an Indian OEM.
Over fourteen years and 100,000 devices deployed across enterprises, we’ve built a dataset most procurement teams never see. Not just unit prices—the actual five-year economics of owning, supporting, and retiring hardware fleets. The numbers surprise most CFOs. Not because Indian hardware is cheaper; it’s often not. But because the variables that matter to procurement are rarely the ones that dominate cost.
Capex: The Visible Variable (And Why It’s Not The Whole Story)
The starting price of a Dell OptiPlex or HP EliteDesk is lower than most assume—between 8 and 12 percent lower than a comparable Indian OEM desktop when you account for bulk discounts and OEM certification requirements. But here’s where procurement teams go wrong: they stop there. A Dell Latitude or ThinkPad carries a 15-25 percent cost premium over an Indian equivalent with identical specs. Global OEMs exploit two levers—multinational sales infrastructure and 20-year brand equity—to sustain those margins. You pay for security certifications, global managed-services integration, and ecosystem breadth. For 40 percent of enterprise deployments, that justifies itself. For the rest, capex savings from Indian OEMs typically range from 6 to 14 percent on the first unit, scaling to 18-22 percent at volumes above 500 units annually.
The trap is assuming capex proportionality. When a CIO compares a Dell deployment to an Indian alternative at list prices, the Dell often looks 12-18 percent cheaper because the OEM has already negotiated the price down through volume discounts their sales team won’t disclose. By the time your procurement team sees it, it’s already a loss leader. An Indian OEM, by contrast, quotes more honestly at scale because our margin structure doesn’t subsidize unprofitable contracts elsewhere. That transparency in pricing is often mistaken for being expensive.
Support Response Time: The First Hidden Cost
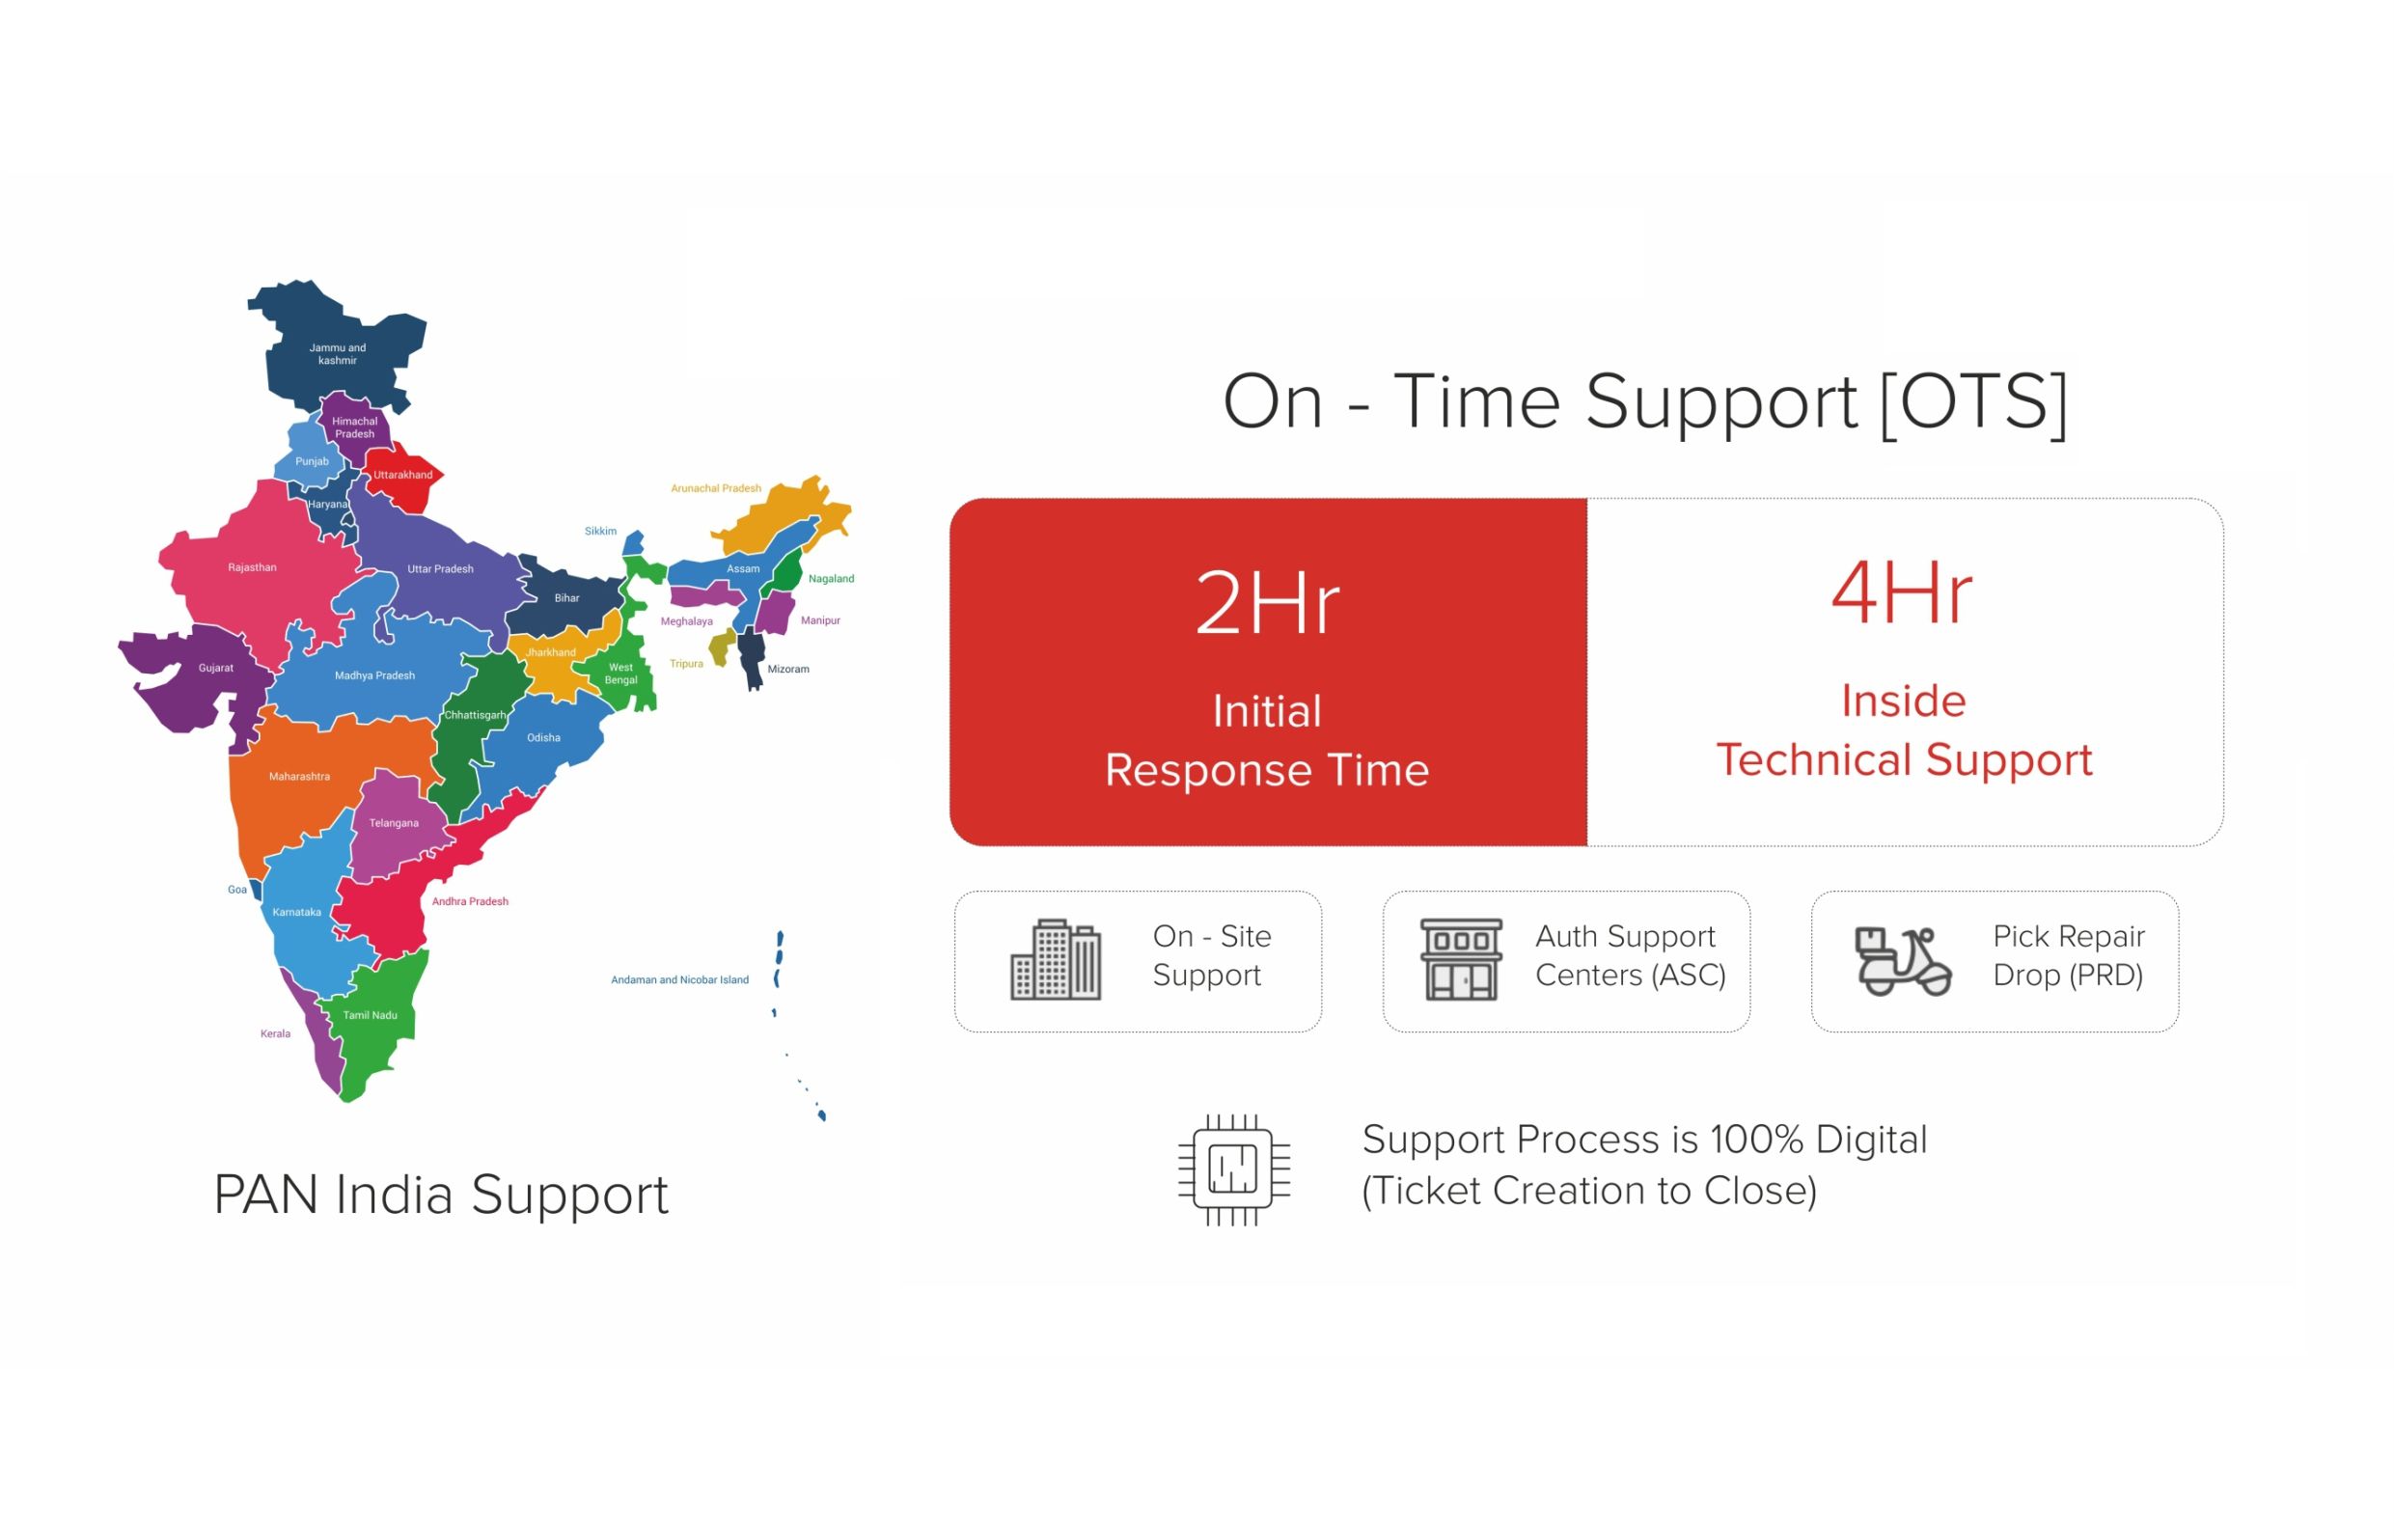
Here’s where the five-year economics pivot. When your fleet has a critical hardware failure—say, 50 laptops simultaneously report disk controller issues—the question isn’t “who supplied the hardware.” It’s “who can be at your facility within four hours.” Global OEMs excel at multinational contract management. They also excel at queuing you behind Singapore, Southeast Asia, and the Middle East during crisis windows. A typical Dell or HP escalation during peak season (March–May, September–October) runs 24–48 hours for first-line support, often stretching to 72 hours for on-site replacement in Indian metros. During the COVID-era chip shortage, we fielded support calls from enterprise clients who had waited eleven days for an HP replacement unit at a tier-1 Indian city.
An Indian OEM’s support response time sits between 4 and 24 hours depending on geography and contract tier, with metro-area SLAs typically at 8–12 hours for critical issues. That translates to real cost. A day of downtime for a 100-person finance team costs more than the hardware warranty ever will. You won’t see this in a TCO model built on spreadsheet assumptions. You see it when a transaction-processing system goes down at 2 p.m. on a Friday because the graphics subsystem failed and the replacement unit arrives Monday morning instead of Saturday afternoon.
Warranty Claims and Field Failure Rates: The Data No One Publishes
This is where we become honest about global OEMs’ reputation. A ThinkPad or MacBook has been built, tested, and refined for 15–20 years. The field failure rate for a five-year-old ThinkPad is between 2 and 3 percent per annum. For an Indian OEM’s comparable desktop—same components, same supply chain—the rate sits between 2.5 and 4.5 percent per annum. That 1–2 point difference compounds. Over five years, a fleet of 1,000 ThinkPads experiences 100–150 warranty claims annually. A comparable Indian fleet experiences 125–225. The cost per claim is roughly equivalent—parts are identical, labor is similar—so the total warranty spend diverges by 8–15 percent on a five-year horizon, always favoring the imported option.
But there’s a second layer. Warranty claim processing speed matters. A global OEM’s ticket workflow is optimized for volume and global SLA consistency. An Indian OEM’s is optimized for speed and local accountability. For a field failure on a ThinkPad, you typically wait 5–7 business days for diagnosis and parts shipment. For an Indian OEM desktop, you wait 2–3 days. The cost per claim is lower by about 12 percent for Indian OEMs, because support overhead is lower and replacement parts are stocked closer to demand centers. In a fleet of 500 devices, this difference equals one extra full-time support headcount over five years. Over 2,000 devices, it approaches two FTEs of internal resources you no longer need.
The honest accounting: global OEMs win on reliability, period. But they win by 1–2 percentage points, not 10–15. And that margin is shrinking as supply chain localization favors Indian OEMs.

Field Serviceability: The Structural Advantage
Here’s where Indian OEM economics break in favor of domestic manufacturers, and it has nothing to do with quality. It’s geography and regulation. A Dell or HP laptop requires a certified service center visit for any component swap beyond RAM or battery. In most Indian metros, you’re choosing between a regional hub (4–6 hours travel time) or on-site service (premium SLA, 48-hour wait). An Indian OEM can typically authorize field technicians—either directly employed or trained partners—to perform component-level repairs at your facility within 24 hours in metro areas, 48 hours in tier-2 cities.
This structural advantage translates to downtime cost. When a Dell Latitude’s motherboard fails during month 32 of a five-year cycle, the warranty has just expired, and the repair cost is £180–220 (roughly ₹18,000–22,000). If you’re three hours from a Dell service center, you’re also absorbing two days of logistics time and technician scheduling. An Indian OEM’s field service partner can replace an equivalent component at your facility for ₹12,000–15,000 and arrive within 24 hours. The repair economics swing sharply toward Indian OEMs between year 3 and year 5, when warranties are expiring and out-of-warranty repairs dominate your support budget.
For organizations with distributed operations across 8–15 cities, this advantage compounds into a two-full-time-employee equivalent savings annually, even for smaller fleets. For enterprises with 3,000+ devices, field serviceability often tips the five-year TCO in favor of Indian OEMs by 5–8 percent, despite higher failure rates.
Residual Value: The Forgotten Variable
Procurement teams almost never model this, and it costs them tens of lakhs annually. After three years, an HP EliteBook with an Intel 12th-gen processor has a residual value of roughly 28–32 percent of original capex in the Indian secondary market. A comparable Indian OEM laptop holds 20–24 percent. The gap narrows further in years 4–5, where an imported laptop’s resale value drops to 12–16 percent and an Indian equivalent holds 10–14 percent. On a fleet level, this is material. A 500-unit deployment of imported hardware refreshed at year four generates roughly ₹45–55 lakhs in salvage value. An equivalent Indian fleet generates ₹32–40 lakhs. The difference is ₹13–15 lakhs of lost working capital, or roughly 2.8–3.2 percent of the original five-year capex.
This spread exists because secondhand imported hardware carries perceived quality premiums in India’s informal market, despite comparable actual reliability. As Indian OEMs build reputation, this gap will compress. For now, it’s a real cost that lives below the line in most TCO models. An organization with a 2,000-unit refresh cycle loses ₹50–60 lakhs in residual value annually by choosing Indian hardware, all else equal. That’s a 1.2–1.5 percent headwind over five years that vanishes when you audit the actual warranty claim rates and support response times from your deployed fleet.
When Global OEMs Still Win
Let’s be direct: if your organization runs SAP with multinational managed-services contracts, or you have enterprise agreements with Dell or HP that subsidize AI workload expansion, global OEMs often remain the right choice. The integration cost of a best-of-breed vendor stack built for Lenovo or Dell is real and rarely pencils out in favor of a parallel Indian OEM deployment. For organizations in regulated industries (fintech, pharma, defense) where audit trails and multinational compliance matter, global OEMs also retain structural advantages. An Indian OEM’s ISO 9001 certification is necessary and genuine. It is not equivalent to the twenty-year audit history that ThinkPad deployment brings.
The honest finding: Indian OEMs win on five-year TCO for organizations with fleet sizes above 500 units, distributed geographies across Indian metros and tier-2 cities, and workloads where component-level repair speed matters. For centralized facilities, stable IT teams, and cloud-forward architectures that don’t care about on-prem hardware refresh economics, global OEMs often remain the simpler choice despite higher cost. The decision shouldn’t rest on capex alone—it rarely does in companies that actually audit their fleet economics.
Integrating Indian Hardware Into Your Fleet Strategy
The data suggests two paths. The first is a hybrid model: Indian OEMs for distributed field operations where field serviceability and response time matter, global OEMs for centralized facilities where managed services and brand reputation justify premium capex. The second is a full Indian OEM deployment coupled with internal build-out of IT support capability, which typically pays for itself within 2.5 years on fleets above 1,000 units.
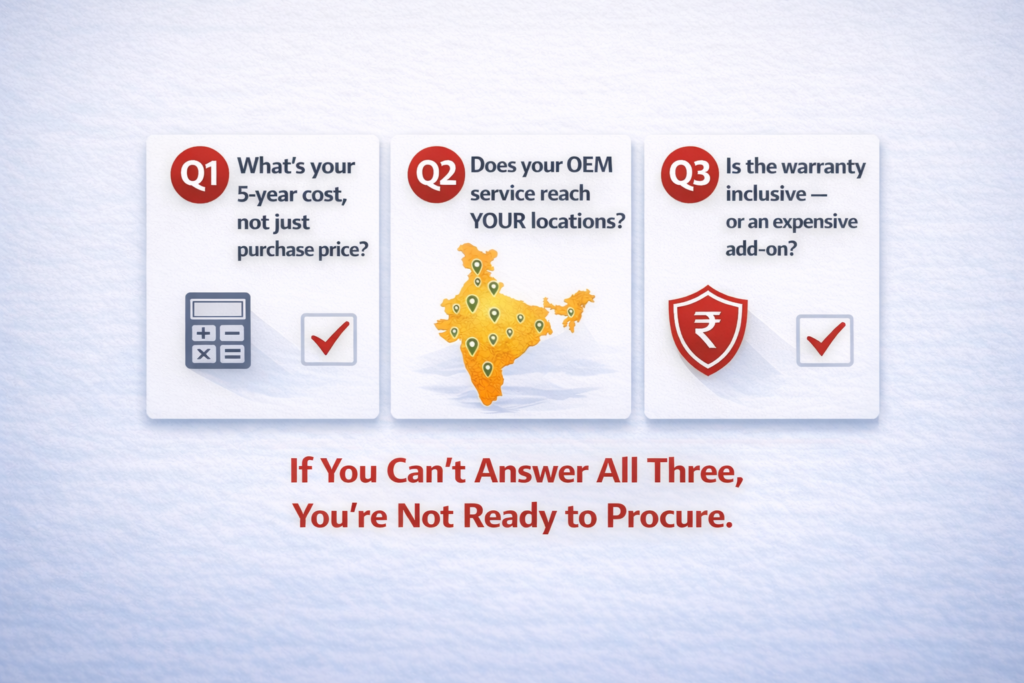
What matters most is auditing your actual fleet economics rather than your assumptions. If you’re comparing an imported laptop against an Indian equivalent, model five variables: capex, support SLA achievement (not contract SLA—actual), warranty claim rate from your deployed fleet, field-repair cost and time, and residual value post-refresh. On that data, not on vendor reputation, the choice becomes clear. For most enterprise organizations in India, it will surprise you. This is also where models like the RDP AI PC and standard desktop offerings begin to reshape procurement conversations, because they’re not asking you to trust that Indian hardware is “good enough.” They’re asking you to audit whether imported hardware is actually earning its premium.
The five-year fleet economics rarely lie. The RFP conversation usually does. Start your TCO analysis with data from your own infrastructure, not vendor benchmarks. You’ll find the five variables we’ve outlined here explain 85-92 percent of the spread. Everything else is brand premium, and brand premiums are worth less than most procurement teams believe when they’re weighed against field economics, response time, and repair speed in the Indian operational context.
Related Reading
For the refresh-cycle framework this TCO analysis plugs into, read the 2026 AI PC fleet refresh decision framework. Explore RDP AI PCs designed for Indian enterprise fleet economics.
Table: 5-Year TCO Comparison — Indian-Manufactured vs Imported Desktop Fleet (1,000 Units)
| Cost Head | Indian OEM (e.g., RDP) | Tier-1 Import (MNC Brand) | Refurbished (3–4 yr old import) |
|---|---|---|---|
| Acquisition (per unit) | ₹28,000–38,000 | ₹38,000–55,000 | ₹14,000–20,000 |
| Deployment and Imaging (per unit) | ₹800–1,200 (local support available) | ₹1,200–2,000 (fewer local engineers) | ₹2,000–3,500 (config variance adds time) |
| Energy Cost (5 yr, per unit @ ₹7/kWh) | ₹8,400 (65W TDP, 8 hr/day) | ₹10,500 (avg 85W, older platform) | ₹13,000 (avg 110W, legacy chipset) |
| Support / AMC (5 yr, per unit) | ₹4,000–6,000 (on-site NBD, local spares) | ₹8,000–14,000 (depot-based, imported spares) | ₹12,000–20,000 (no OEM support; 3rd party) |
| Downtime Cost (est., 5 yr, per unit) | ₹3,000 (low — fast NBD response) | ₹7,000 (moderate — depot turnaround) | ₹18,000 (high — parts unavailability) |
| Refresh / Residual Value (yr 5) | ₹4,000–6,000 buyback (local demand) | ₹3,000–5,000 | ₹500–1,500 (scrap value only) |
| Total 5-Yr TCO (per unit) | ₹40,000–52,000 | ₹58,000–80,000 | ₹59,000–74,000 |
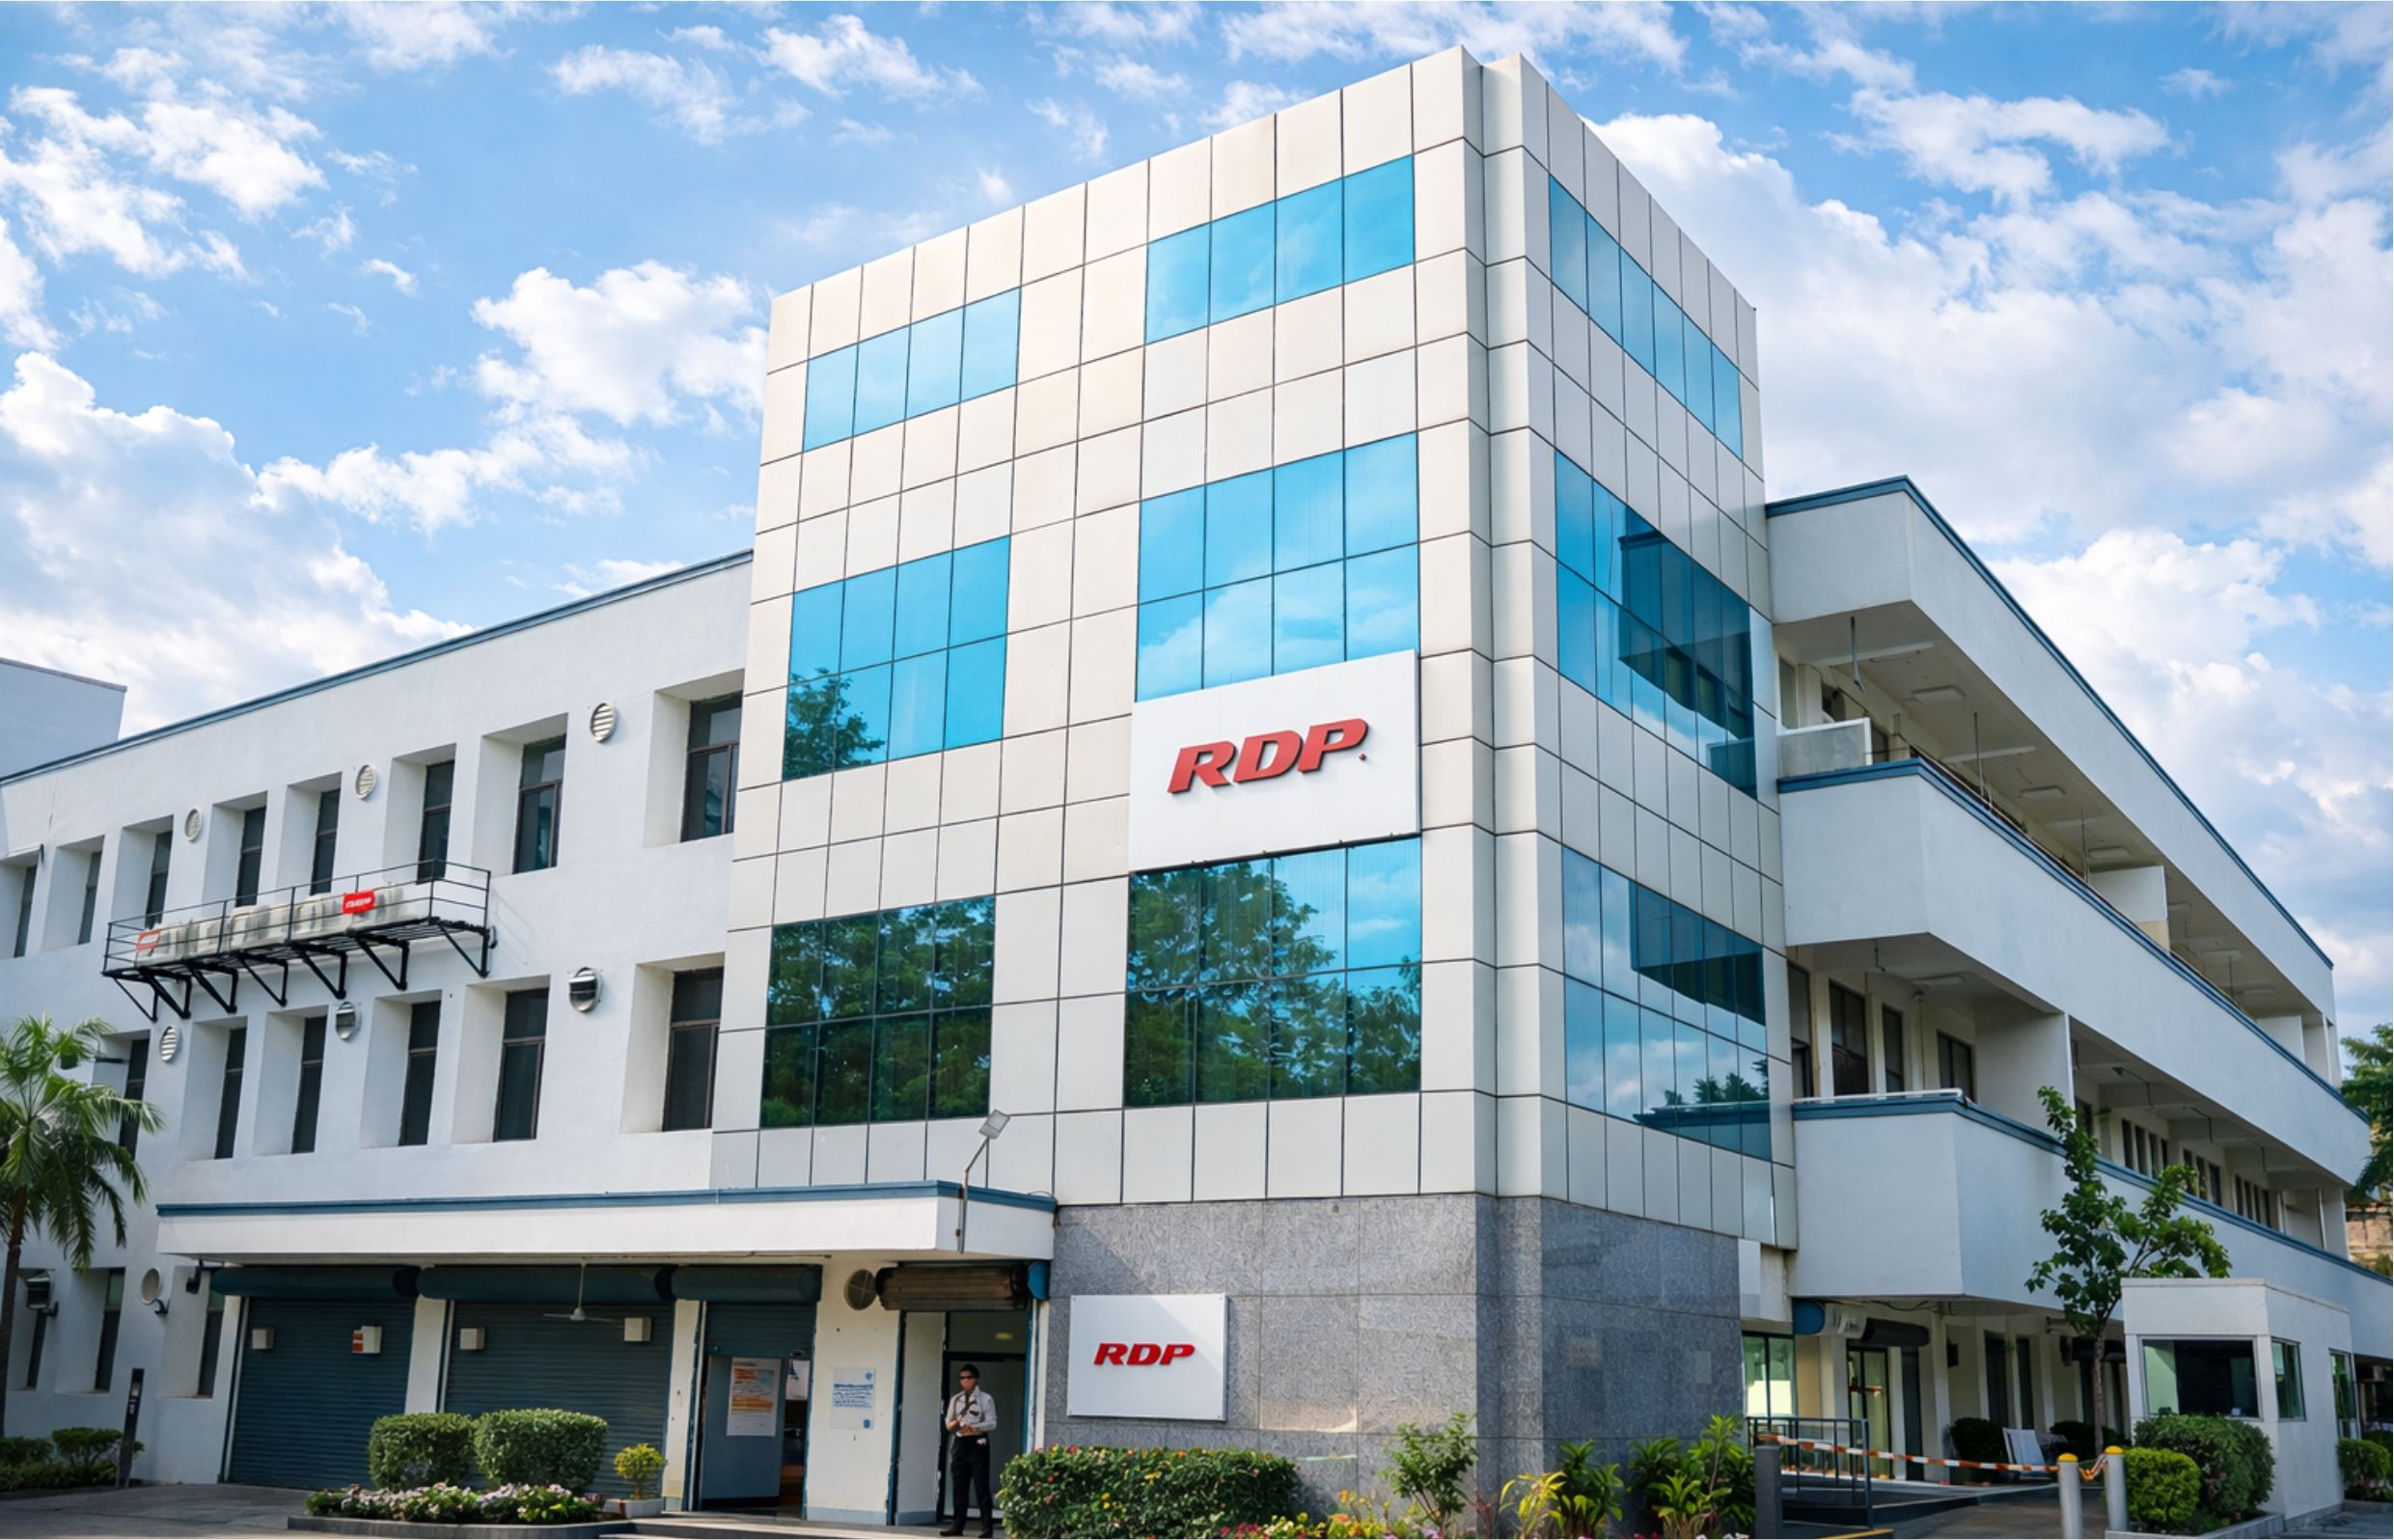
RDP Technologies Limited designs, manufactures, and supports IT hardware in India — desktops, thin clients, mini PCs, AI PCs, workstations, servers, and rack-scale AI infrastructure. 14 years. 100,000+ devices shipped. Over 1 million end users. 28,000 sq. ft. facility in Hyderabad. ISO 9001, PLI 2.0, MeitY and BIS registered.
Make in India. Built for an AI-Ready India. Reliability is Our Product.
If you are evaluating IT hardware for your organisation — speak with our team. No sales pitch, just an honest fit review.